ElectroSan BI (Business Intelligence)

Optimizing Data-Driven Decisions for Smarter Business Growth

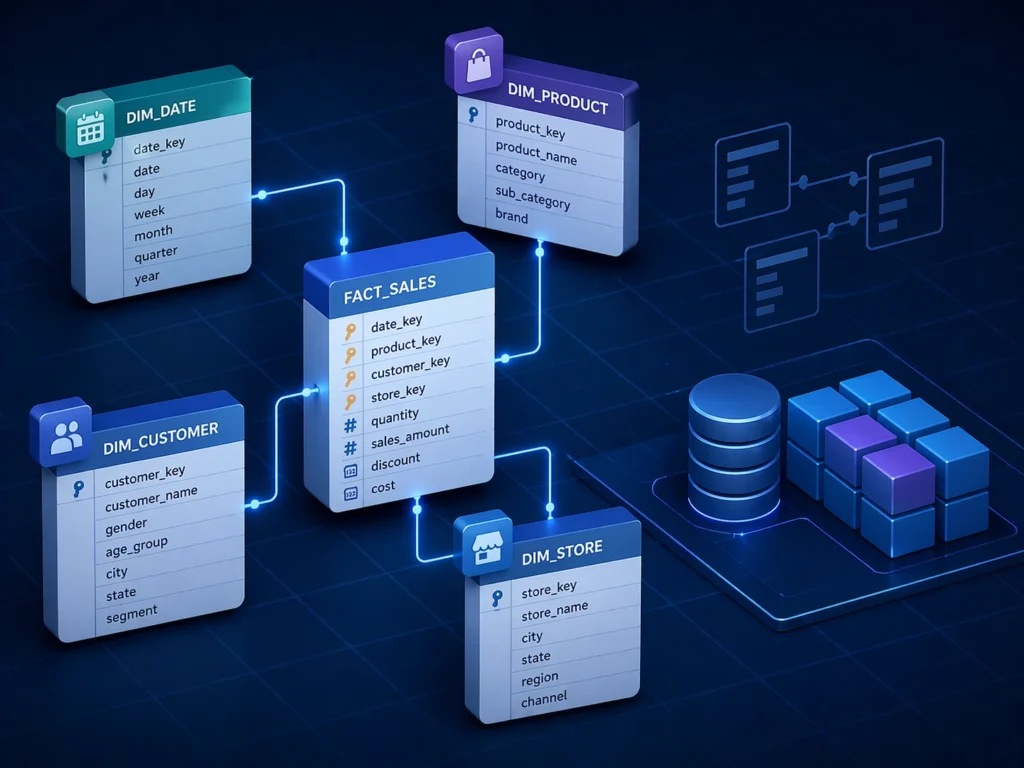
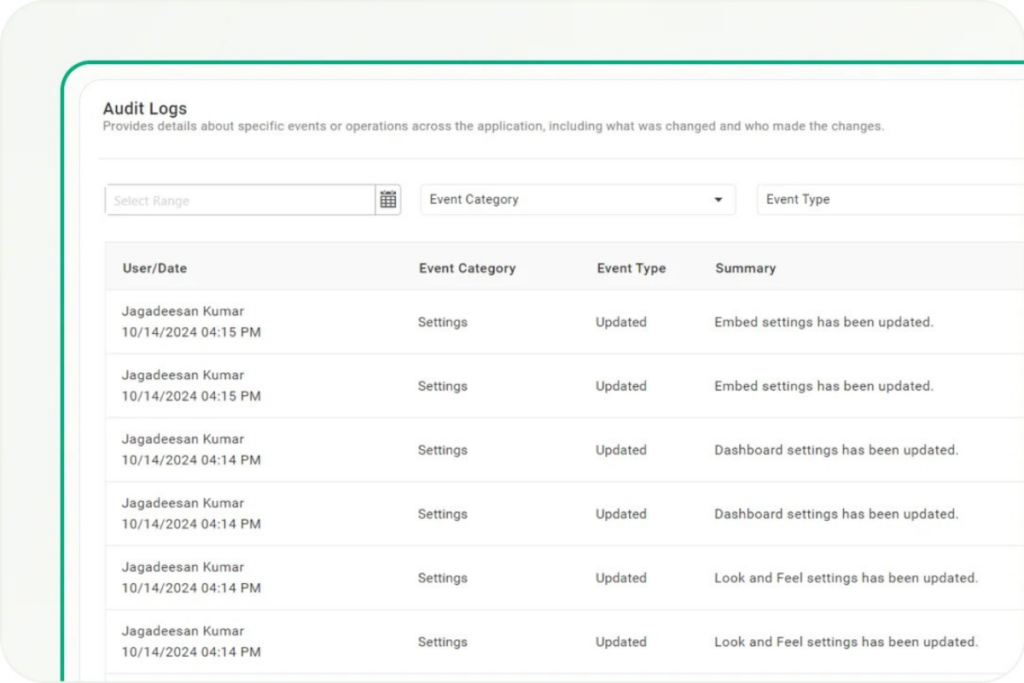
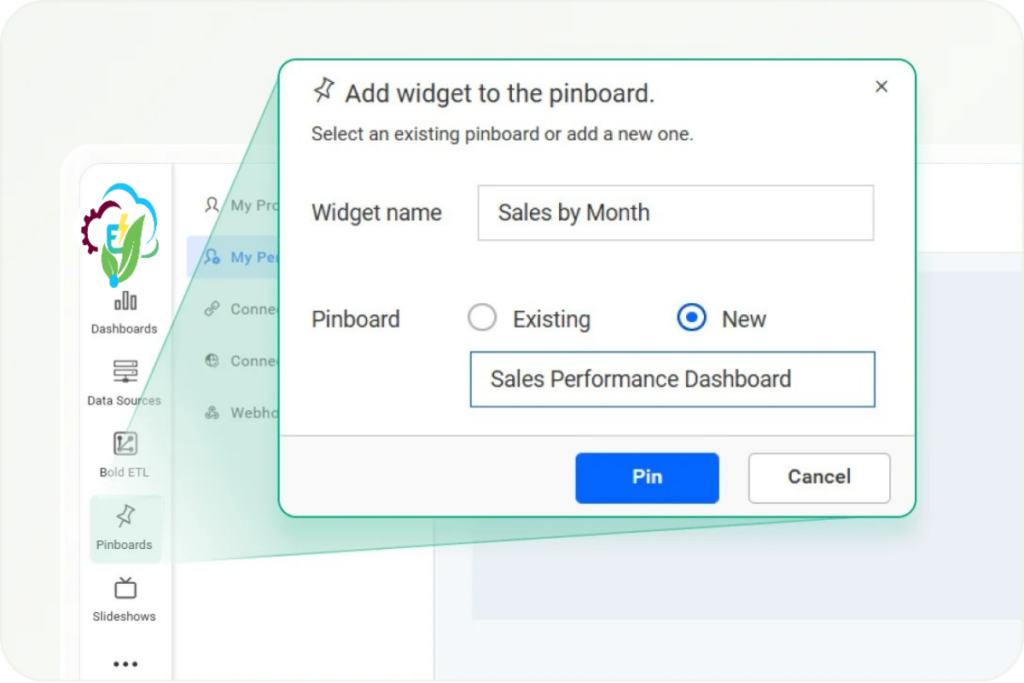
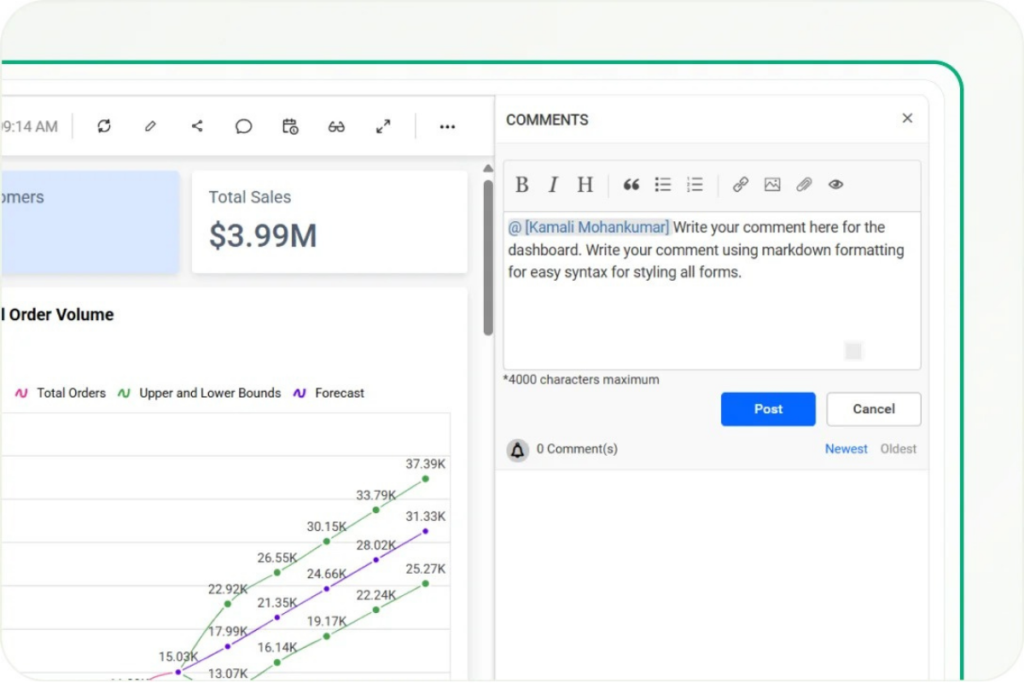
ElectroSan Bl is an intelligent business analytics platform built to empower organisations with real-time data insights, interactive dashboards, and Al-driven decision support.
We help businesses of every size transform raw data into clear, actionable intelligence — enabling smarter decisions, faster growth, and stronger performance across every department.

What We Do

Key Highlights

140+ Data Sources Supported

100+ Chart & Widget Types

AI-Driven Natural Language Queries

Al-Powered Analytics

ElectroSan Bl brings Generative AI to your data — ask a question, get an instant dashboard. No SQL No wait.

smarter Analytics with Generative AI

Harness the power of GenAl to analyse your data automatically — uncovering patterns, trends and insights without manual effort.

Al Copilot

Your intelligent analytics assistant that guides you through data exploration, suggests the right visuals, and accelerates every decision.

AI Agent

An autonomous Al that continuously monitors your data, detects anomalies, forecasts outcomes, and surfaces critical insights proactively.

Smart Narrations for Dota Clarity

Al automatically generates plain-language summaries of your dashboards — turning complex charts into clear, shareable stories everyone can understand.

Prompt to Dashboard

Type a question in natural language and ElectroSan Bl instantly builds a complete, interactive dashboard — from prompt to insight in seconds.

Self Services Connect and Build

Data Integration

Connect to 140+ data sources databases, cloud apps, spreadsheets and APIs  quickly and securely.

  • SQL Server, MySQL, PostgreSQL, Oracle
  • Google Analytics, Salesforce, Shopify
  • AWS, Azure, Snowflake, BigQuery
  • Excel, CSV, JSON and REST APIs

Data Modeling

Shape your data using joins, filters, expressions and calculated fields — no coding required.

  • Visual drag-and-drop field mapping
  • Joins, filters and custom expressions
  • Calculated columns without writing SQL
  • Reusable models across dashboards

Live & Scheduled Refresh

Keep dashboards current with live connections or automated scheduled refresh intervals.

  • Hourly, daily or custom refresh schedules
  • Live data connections for real-time views
  • Failure notifications to data source owners
  • Timezone-aware scheduling

Mobile BI

Access dashboards on any Android or iOS device — stay informed and make decisions anywhere.

  • Native Android and iOS apps
  • Responsive layouts for phones and tablets
  • Full filter and drill-down on mobile
  • Favourites and offline access

Self Services Build and Share

Quick Setup

Build dashboards in minutes
using a drag-and-drop designer. No technical skills needed.

  • Intuitive widget palette and
    canvas
  • Pre-built templates to start
    instantly
  • Auto-save and publish in
    one click

Data Visualization

Choose from 40+ chart types — bar, line, pie, maps, heat maps and more to tell your data story.

  • Bar, column, pie,
    doughnut, radar charts
  • Geo maps and heat
    maps for location data
  • KPI cards, gauges and
    number tiles

Custom Layouts

Responsive and fixed layouts that adapt to any screen size — desktop, tablet or TV display.

  • Responsive layout auto-adapts to devices
  • Fixed layout for pixel-perfect designs
  • Brand colours, fonts and custom themes

Slideshows & TV Mode

Display dashboards as auto-playing slideshows for meeting rooms, office screens and presentations.

  • Auto-cycle multiple dashboards in
    sequence
  • Full-screen TV mode for live wall displays
  • Custom transition intervals and ordering
  • Perfect for operations centres and lobbies

Collaborate & Share

Share dashboards with teams or clients and control exactly who can view, edit or download.

  • Share via link, team group or public URL
  • Granular permissions: Read, Write, Delete
  • Embed code for direct app integration
  • Multi-tenant: keep each client isolated

Collaborative Analytics

Collaborate in Real Time

Empower teamstoanalyse and discuss metrics in one interactive workspace with live updates across all users.

  • Shared live workspace for all team members
  • See data changes and comments instantly
  • Keep decisions aligned across the organisation
  • Improve productivity with unified analytics

Share Dashboards Securely

Distribute dashboardssafely usingdirect access links with full control over who can view or edit data.

  • Copy and share permission-protected links
  • Only users with access rights can view
  • Ideal for private, team and public reports
  • Share with individuals or entire groups

Comment on Data Instantly

Turninsights into discussions directly on charts or KPIs — every comment stays linked to the specific data point.

  • Inline comments on any chart or KPI widget
  • Threaded replies for ongoing discussions
  • @mention teammates to request attention
  • Markdown formatting for rich comment content


Export & Distribute Insights

Export dashboards or widgets toPDF, Excel or image formats and share insights outside the platform with ease.

  • PDF export in A3, A4, A5 and Letter sizes
  • Portrait and landscape orientation options
  • Excel and image export for flexible sharing
  • Support for presentations, compliance and exec summaries


Automate Email Alerts

Keepteams updated automatically with scheduled dashboard deliveries and KPI threshold breach notifications.

  • Schedule dashboards to users or groups on a timer
  • Instant alert when a KPI breaches its threshold
  • Time-based or data-driven scheduling options
  • Configurable per dashboard and per widget

Role-Based Access Control

Protectsensitivedata by assigning tailored permissions to each user, team or department in your organisation.

  • Granular rights: Read, Write, Delete and Download
  • Private dashboards visible only to permitted users
  • SSO, LDAP and Active Directory integration
  • Manage access from a single permission panel

Distribute Live Dashboards

Instantly publish dashboardswith real-time data so every stakeholder always works with the latest information.

  • Share with individuals or entire groups instantly
  • Real-time data visible to all authorised recipients
  • Fast, informed decision-making at any scale
  • Keep everyone working from a single source of truth

Personal KPI Pinboards

Let users pin key metricsfrom different dashboards into personalised views tailored to their own goals.

  • Pin any widget from any dashboard to a pinboard
  • Create a new pinboard or add to an existing one
  • Keep critical KPIs always front and centre
  • Individual views without  affecting shared dashboards

Audit Logs & Activity Tracking

Gain full visibility withdetailedaudittrails that track every user action and every data change across the platform.

  • Filter logs by date range, event category and type
  • Track exactly who changed what and when
  • Monitor settings, dashboard and data source changes
  • Meet compliance and enterprise security requirements

Examples of Report Pages

Unlock Smarter Growth With ElectroSan’s Advanced Business Intelligence

Transform your business with powerful data insights using ElectroSan’s cutting-edge Business Intelligence solutions. Visualize performance, uncover hidden opportunities, and make faster, data-driven decisions. Turn your data into a strategic advantage and accelerate growth with confidence.

Make appointment

Let's Get started

Feel free to reach out to us with any inquiries or feedback – we’re here to assist you!